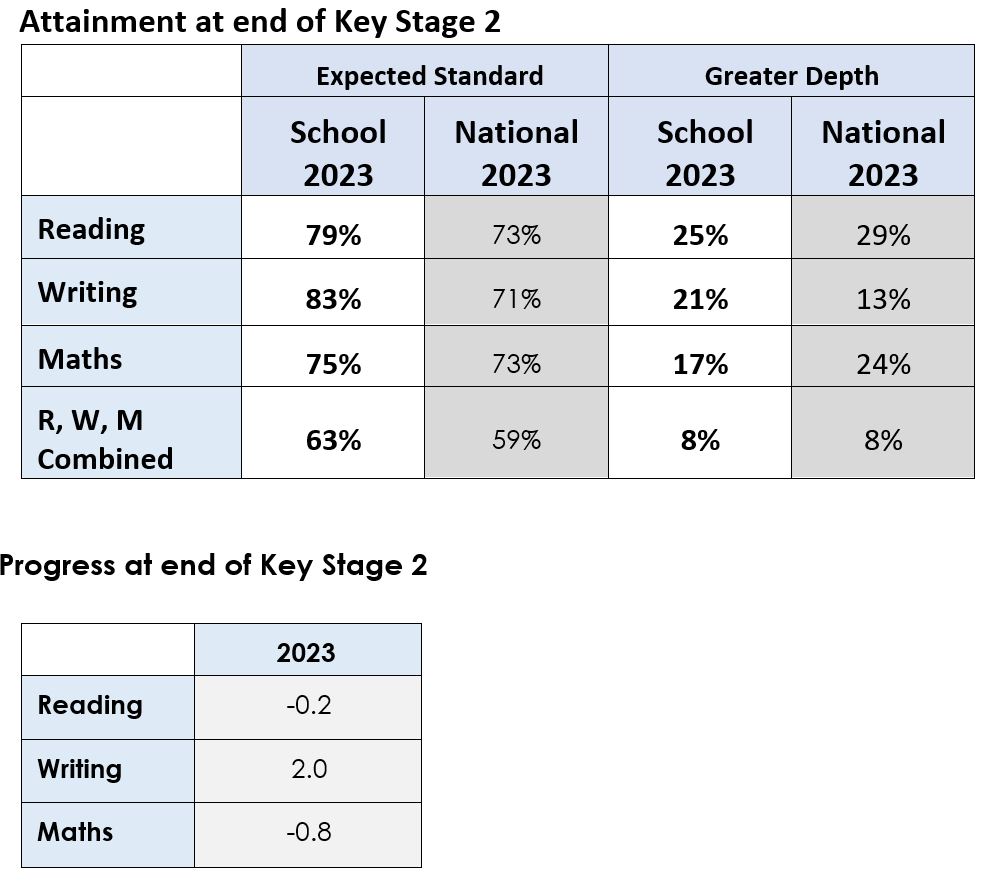
KS2 Performance Data
| Indicator | 2019 |
| The % of pupils achieving the expected standard in reading, writing and mathematics | 71% |
| Average progress in reading | 0.3 |
| Average progress in writing | -1.2 |
| Average progress in mathematics | 0.2 |
| % of pupils achieving a higher standard in reading, writing and mathematics | 11% |
| Average scaled score in reading | 107 |
| Average scaled score in mathematics | 107 |
No primary test or assessment data has been published for 2020, 2021 or 2022. You can view the 2019 data however this data may no longer reflect a school’s current performance.
2023 End of KS2 Outcomes

Compare Our Performance
The above link will take you to the Department of Education’s Performance tables and you can see how our school compares within our County and nationally.
Financial Benchmarking
You can view your school or academy trust’s financial data, see how it compares with others and use the information to establish relationships with other schools or multi-academy trusts.


